An infographic is a lot more than just a JPEG which looks good and conveys the information in an appealing form. Apart from that, it can be used in many more ways than just a post on your website or a social sharing item. With so many types of infographics in the market today, it’s important to choose the right one for your business.If you’ve ever seen an infographic on your phone you must know how uncomfortable and unimpactful it can be. You may have had to zoom everything, which would have killed the impact of the infographic in that very instant. In many cases, if you share a very long infographic on social media, it may hamper your feed more than helping it. The reason behind this is that most infographics are not mobile responsive, which makes the text on the infographic look extremely small. Same is the case when a long infographic post is shared on social media channels like Twitter. Honestly, I have seen many successful people doing this.
Maximize the Potential of Your Infographic, Make it Go Viral!
So is there a brighter side to it?
Absolutely. Infographic designs have evolved over time to provide solutions that are mobile mobile-friendly. In this article, however, we will focus on how you can use infographics more effectively to maximize outputs.
Here are various forms an infographic can elevate to.
Level 1: The basic JPEG
Level 2: Animate it and make it impactful
Level 3: Make it responsive with HTML
Level 4: Add Animation To HTML Infographics
Level 5: Make it socially shareable
Level 6: Make it viral
Level 7: Make a video infographics
Level 8: Extreme: Make a landing page using infographics to 10x your marketing efforts
Level 1: The Basic Form
Keep JPEG as your chosen format style with an average dimension of 700 pixels by 2000 pixels. Creating a good JPEG infographic is key because you can easily place it anywhere on your website and it can serve as basics for taking your infographic to the next level. The infographic is also great for sharing on websites like Pinterest and for uploading on infographic directories.
Level 2: Make Them Impactful
If you want to make an impact, you must stand out. Adding animation to your infographic allows you to capture the attention of your user, even if it’s for one second. While the same infographic can be shared as an image, making it animated catches the attention even more than a static infographic.
This is a fine and effective way of repackaging an infographic if you do not have the time or the budget for a video but want to avoid making a static infographic. Remember that GIF infographics, also known as gifo-graphics and animated infographics are a bit small as compared to static infographics. This is owing to the limitations of the GIF creation process.
Level 3: Make Them Responsive
The good news is, you don’t have to restrict your infographics to JPEG images and animated GIFs, instead you get them created in HTML. What this does is, it makes your infographic mobile-responsive. So, your infographic looks the same on desktop and it looks great on your phone as well.
Remember, you will still need static infographics along with HTML ones for posting them on directory listings. So, ensure that you hire an infographics designer who can convert a static infographic into an HTML one without any visible difference.
Once you get an infographic created in both formats, you can use the static one for posting on infographic directories and the HTML version for your website. Another benefit of having an HTML infographic or web-based infographic is that it is SEO-friendly. This means that Google crawlers can crawl through the text written on your infographic and help with your SEO-efforts. Read more about it here.
Level 4: Add Animation To HTML Infographics
There is a bit of difference in Level 2 & Level 4. After creating a gifographic or an animated infographic, you can easily convert it into an HTML version. What this does is that it removes the ‘size’ limit from the animated infographics, so you can create one big infographic made up of many small ones. To be clear, there is no restriction on size when creating HTML infographics.
Level 5: Go Social The Right Way
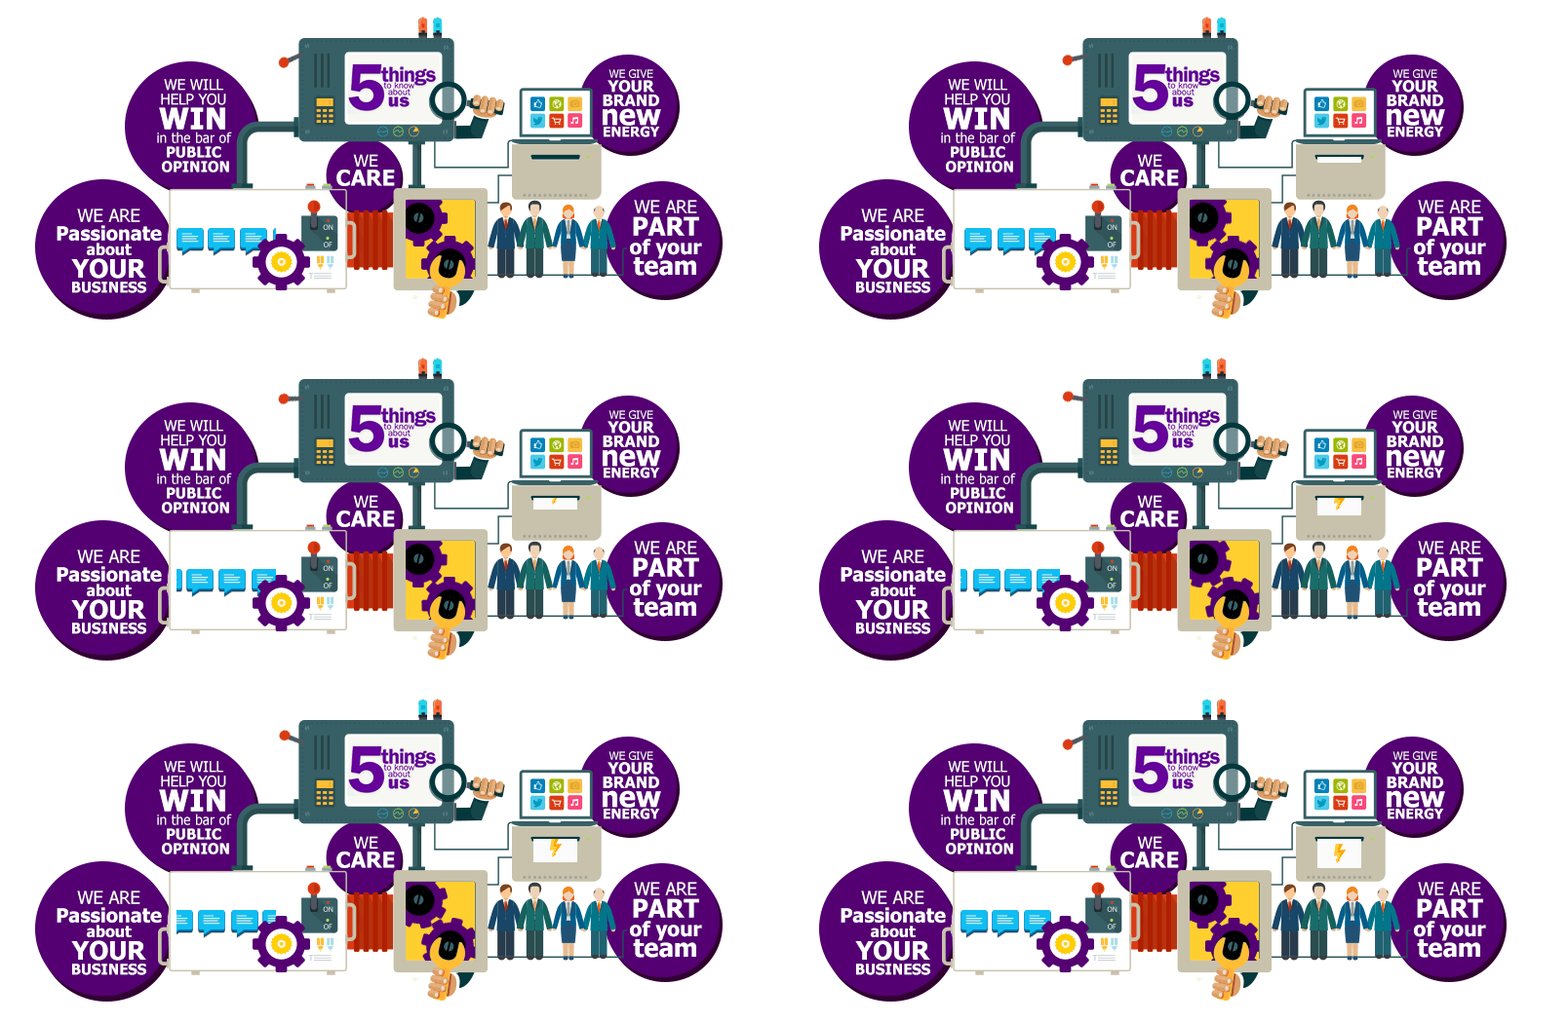
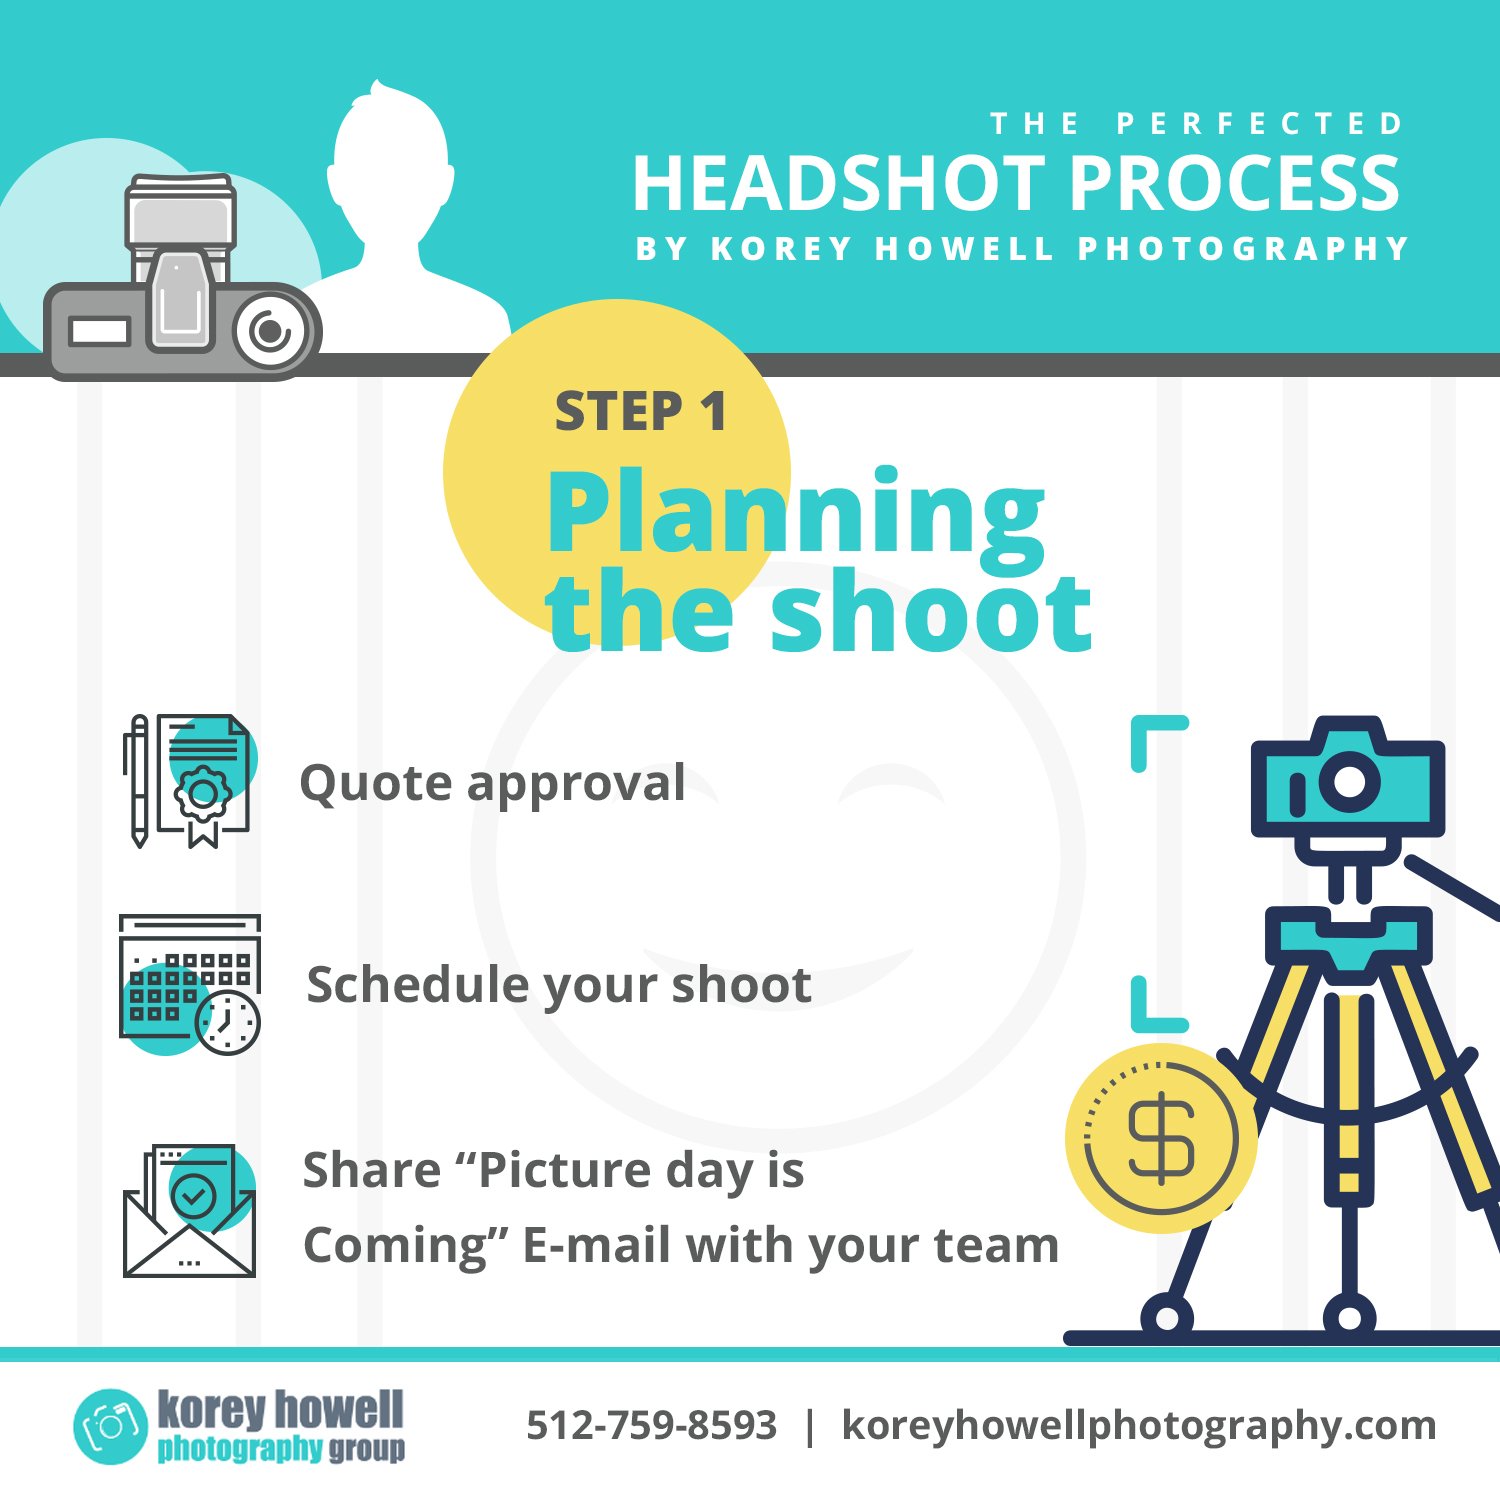
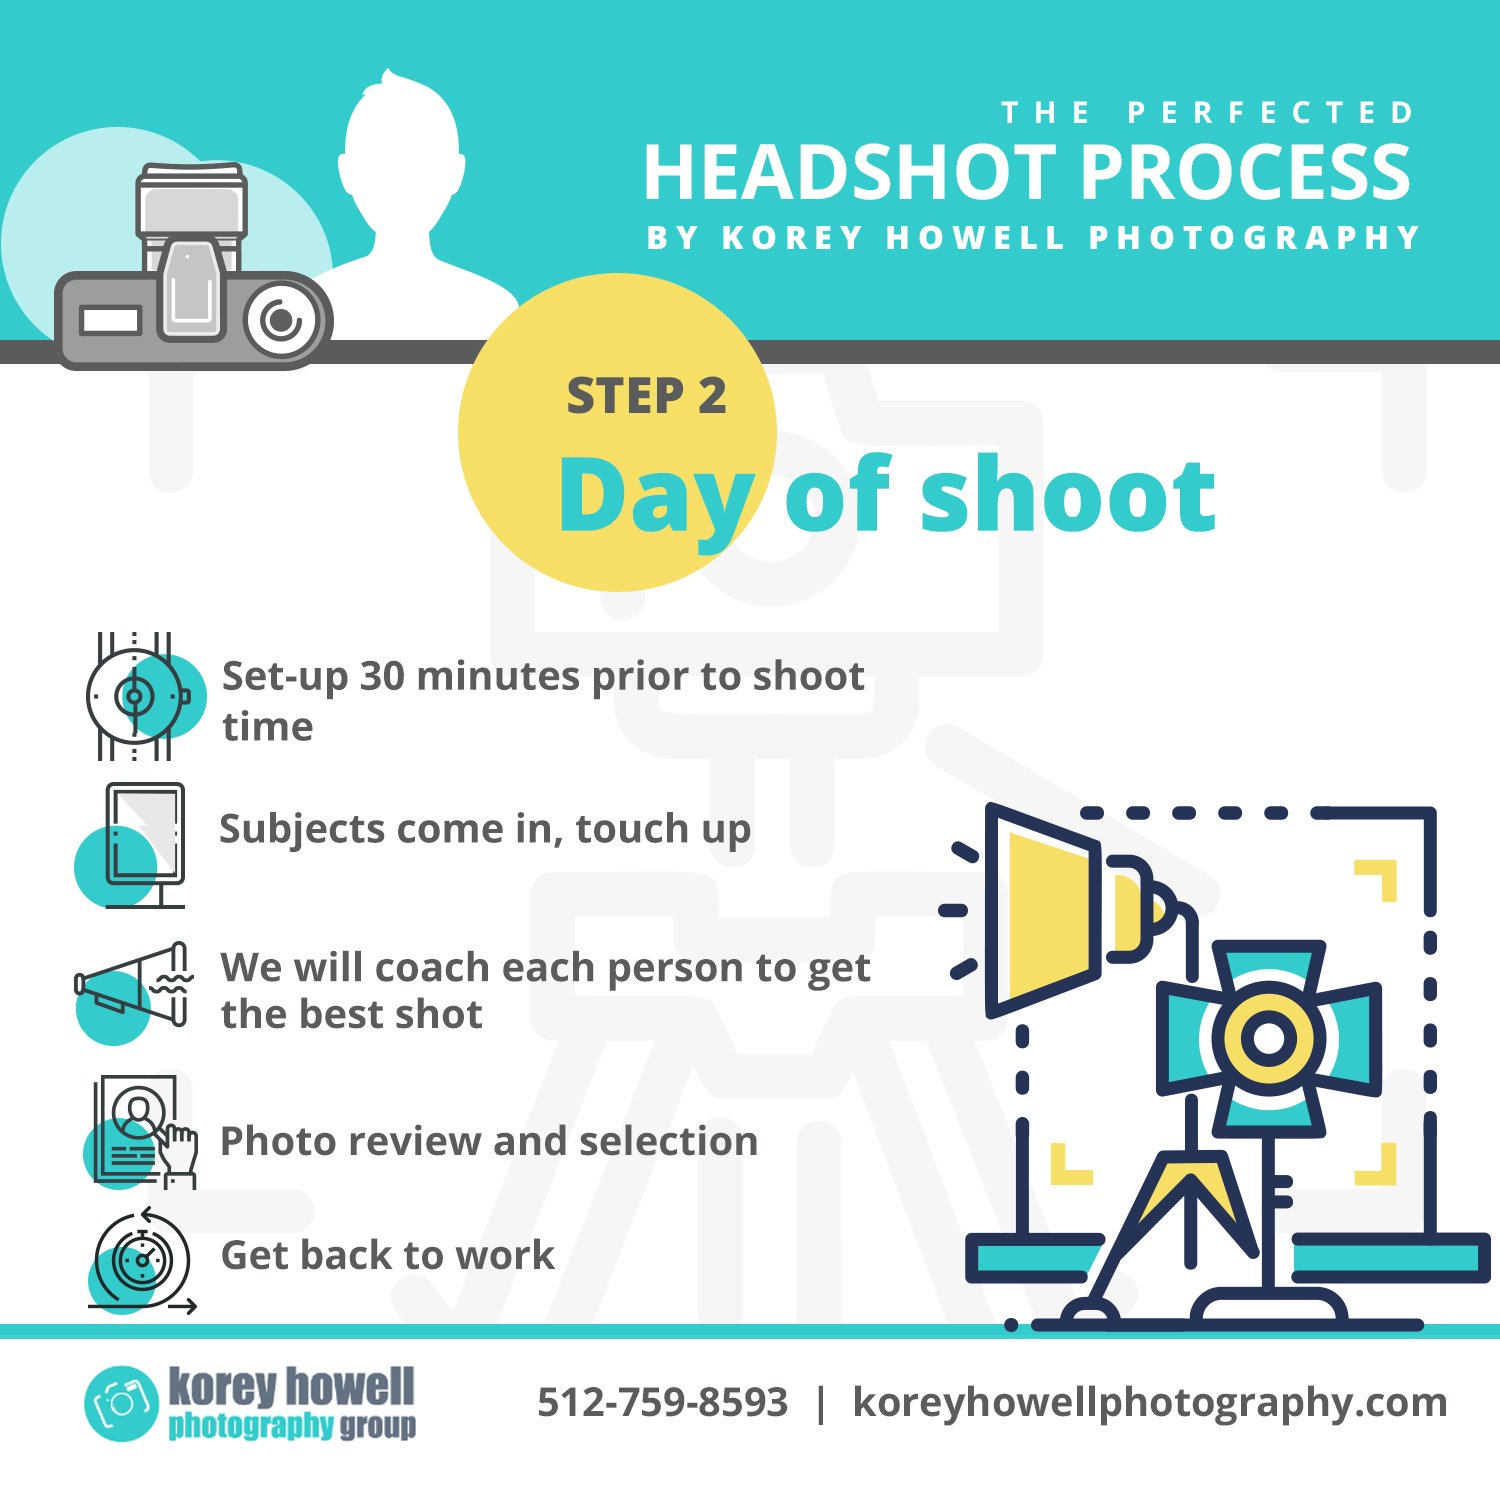
Take over social media by creating multiple small infographics instead of one big infographic. Or break down, a big infographic into smaller cards. This is because long-form infographics take up too much space and don’t look so great on social media. The best possible solution for you in such a scenario is to break down your big infographic into small social infographic cards. This will allow you to easily share your infographics on your Facebook, Twitter, Instagram and LinkedIn fans. So create small social infographic cards that are good to share and can create enough curiosity for users to click on and land on your website.
Level 6: Make Them Viral
Wondering what you can do to make your infographic more successful? There is! You can ask your infographic designer if he/she can post the created infographic on to infographic directories to generate more visibility. The infographic can also be used in its appropriate form on various discussion forums like Quora, Reddit, etc. Imagine how cool it will be to answer a question related to solar energy with a nice infographic as compared to plain text! The person asking the question will be happy and may even convert into a lead.
Level 7: Video Infographics
There is another evolved form of infographics and can be a lot more impactful than other forms of infographics, depending on the concept being explained. Explainer videos are a good example of video infographics. However be cautious of using video infographics as they are not SEO-friendly and may not be useful for posting in directories. Video Infographics can be a very good addition to your existing infographics. Here is an example of a static infographic as well as a video infographic.
Landing pages are very good tools for getting leads and generating business. However, you can enhance the purpose of your landing page even more, by using the art of visual storytelling and adding different-level infographics to your landing page. The infographic on the landing page can be used to explain a product, to provide important information or to present your work timeline. The power of infographics and landing page combined together can bring in better results than ever before!
Now that you know the levels at which you can take your infographics, it’s time to start executing. You may try creating a few infographics online, but you will need a designer or an agency to handle complicated infographics. There are a very few infographic design agencies who can offer it all to you. To get a unique infographic that best suits your needs, you can easily get in touch with The Dreamer Designs. We are a passionate bunch of designers, researchers, and content creator and have been leading the space of infographics and have designed over 1200 infographics for brands like Mercedes, Nokia, Microsoft, CupoNation and more. You can also see some of the work we’ve done by checking out our portfolio.
Nishant Sapra
Nishant Sapra is an Indian design solution expert and infographic maestro, an avid learner with over 20 certifications in various business and design domains, and an Author too. He is the founder and creative head at The Dreamer Designs, an award-winning design agency from India. He is an entrepreneur with three businesses in the field of education, design, and e-commerce. When not working he likes reading, socializing, and spending time with his family. His dedication to extraordinary and beauty have compelled Nishant to hike his brand to international clients. You may be familiar with one of his pan-global projects, such as projects with brands like Mercedes, Microsoft, and Upwork. If not, howdy and lovely meeting you! Find him online (site/ mail/ facebook /linkedin)