COMMUNICATIVE & PROFESSIONAL
Static Infographics
Not just Infographics but a lot more. If you have the content written already, do not wait any further to see it converted into a result-oriented design.
In the world of information, infographics can be considered as the best way to consume information. An average user reads only 28% of the information that is spread out across a website, which can affect ones business. Employing infographics will help you gain more traffic on your website and bring genuine clients to your business. Infographics are a fun way to remember and understand stuff.
Cuponation
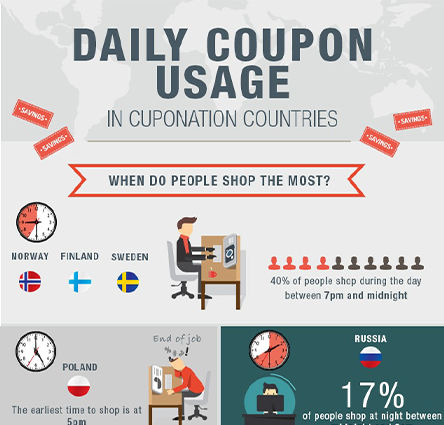
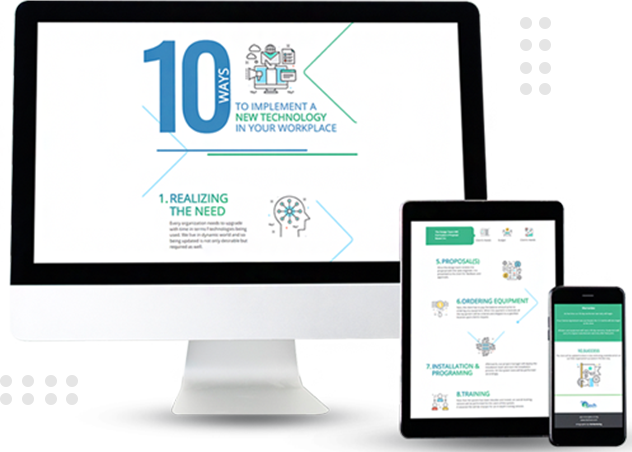
They can improve your outreach by 12% and help you get popular.
Infographics are a proven method to increase your brand footprint which helps you retain more clients due to higher visual stimulation.
SEO content can be strengthened by a well developed infographics.
Since infographics are shareable, you can generate more traffic which also helps your page achieve a higher rank.
We use industry leadings tools like HTML, Premier Pro, Photoshop, Canva, Illustrator, Figma to provide you the best infographics. All our infographics will be of the highest quality and each of them will provide information in a way that your client understand it and make choices based on them.



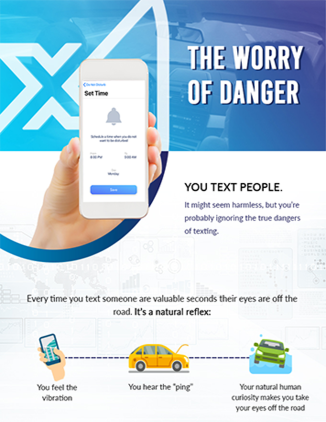

Let’s get started with a quick question-answer round.
These are some of the most commonly asked questions by our existing clients. We presented the answers in the simplest way possible for you. Feel free to contact us with more of such questions in your mind.
Infographic design is the visual representation of complex information or data through graphics, charts, diagrams, and illustrations. It is used to make data more understandable and engaging for viewers.
Infographics help to break down complex information into easy-to-digest visuals that are engaging and memorable for viewers. They can also help to improve engagement rates and shareability on social media platforms.
There are several common types of infographics, including data visualizations, comparison infographics, process infographics, timeline infographics, and geographic infographics.
To create an effective infographic, it is important to have a clear understanding of your target audience and the information you want to communicate. You should also choose a design that is visually appealing and easy to read, use accurate data and statistics, and include a clear call-to-action.
There are several software options available for creating infographics, including Adobe Illustrator, Canva, Piktochart, and Venngage. Each platform has its own strengths and weaknesses, so it becomes important to choose one that best fits our clients
To make sure your infographic is visually appealing, we choose a color scheme that is easy on the eyes, use consistent typography, incorporate high-quality images and graphics, and maintain a clear and organized layout.
To promote your infographic, consider sharing it on social media platforms, submitting it to infographic directories, reaching out to journalists in your industry, and including it in your email marketing campaigns.
To measure the effectiveness of your infographic, track metrics such as social media engagement, website traffic, backlinks, and conversion rates. You can also conduct surveys or user testing to gather feedback from viewers.
We follow these simple steps to design Awesome infographics
1) Understand your requirement
2) Request for content if available
3) If the content is not available, we research the same
4) Create a story
5) Add visual storytelling magic
6) Send for review
An infographic is an art of visual storytelling. It involves the use of graphics, images and icons to create a story that is pretty and easy to understand at the same time.
We can actually consider infographics as the first mode of communication, where early humans used pictures to represent their needs.
In the modern world, we see infographics everywhere. Some of the examples are:- Newspapers showing graphs for election results, interactive presentations showing weather results on a map, etc.
Photoshop, Figma, Adobe Spark, Canva, Visme, Stencil, Freepik, Easel, Infogram, Google Charts, Venngage, Snappa are some examples of some software you can use to make infographics.
But, they only go a long way when you have a great designer to make that happen.
Not that there is a rule, infographics are usually of one page. Other than that, it completely depends upon the purpose of your infographics. If need be, they can be of multiple pages or as long as a book as well.
Infographics can be used anywhere you need to do 2 things:- Get the attention of the reader and not take too much of their time either.
Some of the common uses are advertisements, promotional material, results of the survey, resume, explaining a process, etc.
The main purpose of an infographic is to gain the attention of the user. Infographics easily defeat the barriers of attention, language or boredom. Rather, the visual representation makes it quick and easy to grasp and makes the content engaging.
Infographics are as effective as any other visual content. In fact, they are the perfect way of transmitting intricate information easily.
Infographics go wrong when there is more information than what the audience can stick to.
It can kill the effect of your infographic. It can also alter the whole purpose of making the information easy to perceive.
Infographics make your data process much faster than plain text. Along with it, they’re SEO friendly as well. This makes them pretty important to use for marketing purposes. It has to be a part of your plan to stay ahead in the competition.
5 popular ways in which we use infographics are:
1) As a recruiting tool
2) Presenting survey data
3) Simplifying a concept
4) As a Call to action
5) To raise awareness
A successful infographic has an appealing design, relevant graphs, important data, content to provide context and it collectively tells a story.
An ideal infographic is around 600 pixels wide and around 1800 pixels in length. However, vertical infographics stay between 600-1100 pixels in width.
Infographics deliver complex messages easily, being visually appealing at the same time. It makes them communicate information instantly, simply and effectively.
The content part of the graphics gives the main information and data. It is very important to keep in mind that the text in the body part should be limited to the main data. The text should only have 15-20 words.
The main part of the Infographic is a header in which the title is written. Our focus while working on Infographics is that the title is bold, stylish, attractive, and has a little text supporting it.
Yes, an infographic can be a video. A video infographic presents the audience with intense information easily and tends to improve the impact as well.
Infographics are getting more popular everyday because like every visual content, it is more effective and is a crucial element of a successful marketing mix, as it creates 3 times more leads.
Yes, infographics are SEO friendly as well. Majorly, all the text included is crawlable by search engine crawlers. It can have HTML tags like H1, li, etc.
An infographic presents a story with facts and figures which makes the audience stick their attention to it. Their attention grabbing power makes them work better than plain text.
Yes, anytime is a good time because we make every effort to be available 24×7 for project discussions. Just fill out the form, and our expert will reach out at your preferred time.
If you wish to contact right now. Click here



Lorem ipsum dolor sit amet, consectetur adipiscing elit. Ut elit tellus, luctus nec ullamcorper mattis, pulvinar dapibus leo.

